1QFY2020 Result Update | Kitchen Appliances
August 16, 2019
TTK Prestige
Buy
CMP
`5,800
Performance Update
Target Price
`6,638
Y/E March (` cr)
1QFY20
1QFY19
% yoy
4QFY19
% qoq
Investment Period
12 Months
Net sales
434
419
4
445
(3)
EBITDA
56
55
1
64
(12)
Stock Info
EBITDA margin
13.0
13.2
(27bp)
14.4
(144bp)
(%)
Sector
Kitchen Appliances
Adjusted PAT
36
36
2
44
(17)
Market Cap (` cr)
8,299
Net Debt (` cr)
(182)
TTK Prestige (TTKP) posted results below our expectations on both top-line as well as
Beta
0.7
bottom-line fronts. Revenue grew by ~4% yoy to `434cr due to subdued performance
52 Week High / Low
7,738/4,581
in cookers and cookware segment. On the operating front, margins contracted by
Avg. Daily Volume
784
27bps yoy. Moreover, PAT grew ~2% yoy to `36cr.
Face Value (`)
10
Revenue increased ~4% yoy: TTKP’s top-line de-grew by ~4% yoy to `434cr mainly
BSE Sensex
37,354
due to de-growth in cookers segment (~7% yoy). However, cookware and appliances
Nifty
11,041
segment reported growth of ~5% and ~10% respectively. The management indicated
Reuters Code
TTKL.BO
that the weak growth was due to slowdown in rural demand coupled with delayed
Bloomberg Code
TTKPT.IN
monsoon and absence of institutional orders during the quarter.
PAT grew ~2% yoy: On the operating front, the company’s margins contracted by
Shareholding Pattern (%)
27bps yoy to 13.0% due to higher raw material cost and employee expenses. On the
bottom-line front, PAT grew by ~2% yoy due to lower sales growth.
Promoters
70.4
MF / Banks / Indian Fls
8.7
Outlook and Valuation: During the quarter the company has reported subdued
FII / NRIs / OCBs
10.2
numbers both on top-line and bottom-line. However, the company is confident to
Indian Public / Others
10.7
achieve healthy profitability on the back of new product launches (in pipeline for the
festive season), revival in rural demand coupled with acquisition. Hence, we maintain
buy on the company with target price of `6,638.
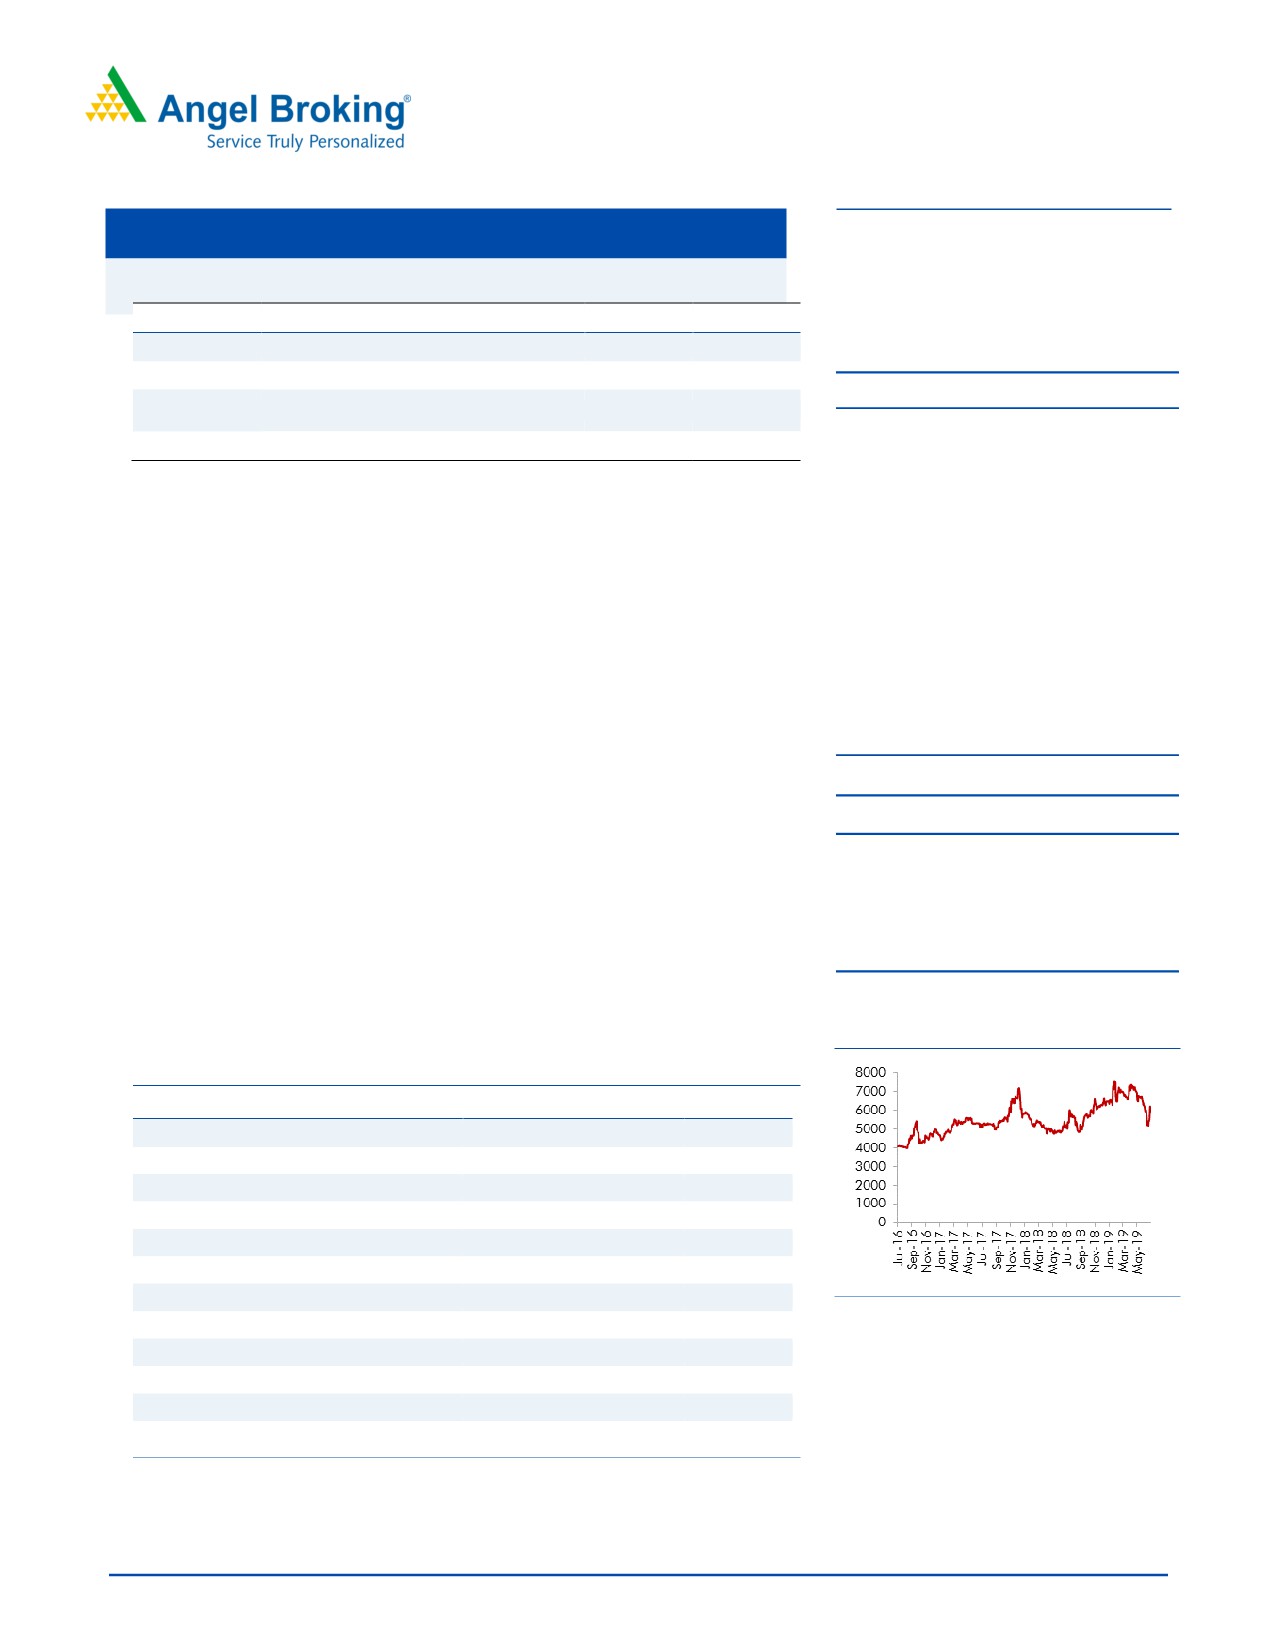
Price Chart
Key Financials
Y/E March (` cr)
FY2017
FY2018
FY2019
FY2020E
FY2021E
Net Sales
1,745
1,871
2,107
2,307
2,557
% chg
-
7.2
12.6
9.5
10.8
Net Profit
154.0
168.9
192.4
210.7
234.9
% chg
(49.0)
9.7
13.9
9.6
11.4
OPM (%)
12.1
13.2
13.9
13.9
13.9
EPS (Rs)
111.6
122.4
139.4
152.7
170.2
P/E (x)
52.0
47.4
41.6
38.0
34.1
Source: Company, Angel Research
P/BV (x)
9.5
7.9
6.9
6.1
5.4
RoE (%)
18.0
16.6
16.5
15.9
15.6
Amarjeet S Maurya
RoCE (%)
19.1
19.3
21.1
20.5
20.4
022
3935 7800 Ext: 6831
EV/Sales (x)
4.6
4.2
3.7
3.4
3.0
EV/EBITDA (x)
37.9
31.6
26.6
24.2
21.9
Source: Company, Angel Research
Please refer to important disclosures at the end of this report
1
TTK Prestige |1QFY2020 Result Update
Exhibit 1: Q1FY2020 Performance
Y/E March (` cr)
1QFY20
1QFY19
% yoy
4QFY19
% qoq
FY2019
FY2018
% chg
Net Sales
434
419
3.5
445
(2.5)
1,968
1,746
12.7
Consumption of RM
249
238
4.7
258
(3.2)
1,131
1,005
12.5
(% of Sales)
57.5
56.9
57.9
40.4
57.4
57.5
Staff Costs
39
38
4.6
43
(8.8)
165
142
16.1
(% of Sales)
9.1
9.0
9.7
8.4
8.1
Other Expenses
89
87
1.3
80
10.8
386
365
5.9
(% of Sales)
20.4
20.9
18.0
19.6
20.9
Total Expenditure
377
363
3.8
381
(0.9)
1,682
1,512
11.3
Operating Profit
56
55
1.4
64
(12.3)
286
235
21.7
OPM
13.0
13.2
14.4
14.5
13.4
Interest
0
0
22.6
0
(7.3)
2
2
9.8
Depreciation
7
6
13.1
7
4.9
26
25
3.4
Other Income
6
5
8
26
143
PBT (excl. Ext Items)
55
54
3.0
65
(14.9)
284
351
(19.1)
Ext (Income)/Expense
PBT (incl. Ext Items)
55
54
3.0
65
(14.9)
284
351
(19.1)
(% of Sales)
12.7
12.8
14.6
14.4
20.1
Provision for Taxation
19
18
21
93
94
(% of PBT)
33.9
33.0
32.5
32.9
26.7
Reported PAT
36
36
1.6
44
(16.7)
190
257
(25.9)
PATM
8.4
8.6
9.8
9.7
14.7
Minority Interest After NP
Extra-ordinary Items
94
Reported PAT
36
36
1.6
44
(16.7)
190
162
17.2
Source: Company, Angel Research
August 16, 2019
2
TTK Prestige |1QFY2020 Result Update
Outlook and Valuation: During the quarter the company has reported subdued
numbers both on top-line and bottom-line. However, the company is confident to
achieve healthy profitability on the back of new product launches (in pipeline for
the festive season), revival in rural demand coupled with acquisition. Hence, we
maintain buy on the company with target price of `6,638.
Risks to our estimates
Abrupt fluctuation in primary raw materials- The prices of aluminum and steel are
linked to global commodity prices and although the company has been able to
pass on the increase in raw material prices to consumers in the past owing to a
strong brand, any failure to do so in the future can adversely impact operating
margins.
Foreign exchange movement- The company imports raw materials and finished
goods as well as makes export sales to countries outside the territories in which
they operate from which exposes it to foreign currency risk. Foreign currency
exchange risks are managed by entering into forward contracts against foreign
currency vendor payables.
Excessive competition/ pricing war TTKP is competing with many different players
in various categories. Many foreign players are also entering Indian markets which
could lead to aggressive competition, and pricing war. So far, TTK has gained
market share from its competitors over the years with its innovative culture and
growth strategies.
Company background
Founded in 1928, the TTK group spans 30 product categories with 7 group
companies and a turnover `3000cr+. TTK Prestige is its flagship company. It
started manufacturing in 1949 by setting up a unit near Bangalore. TTKP was
incorporated as a private limited company in 1955 and it became a public limited
company in 1988. It remained a single product company till 1990. The company
is known for its manufacturing and innovations, be it distributing pamphlets from
helicopters in the fifties or introducing the exchange schemes.
August 16, 2019
3
TTK Prestige |1QFY2020 Result Update
Profit & Loss Statement
Y/E March (` cr)
FY2017
FY2018
FY2019
FY2020E
FY2021E
Total operating income
1,745
1,871
2,107
2,307
2,557
% chg
-
7.2
12.6
9.5
10.8
Total Expenditure
1,535
1,624
1,815
1,987
2,201
Raw Material
1,043
1,082
1,221
1,338
1,483
Personnel
138
159
186
205
228
Others Expenses
354
383
408
443
491
EBITDA
210
247
292
321
355
% chg
(43.1)
17.6
18.0
9.8
10.8
(% of Net Sales)
12.1
13.2
13.9
13.9
13.9
Depreciation& Amortisation
26
26
26
30
30
EBIT
185
222
266
291
325
% chg
(47.0)
20.1
19.7
9.6
11.7
(% of Net Sales)
10.6
11.9
12.6
12.6
12.7
Interest & other Charges
8
4
5
5
5
Other Income
7
141
25
28
30
(% of PBT)
3.7
39.4
8.8
8.9
8.6
Share in profit of Associates
-
-
-
-
Recurring PBT
184
359
286
315
351
% chg
(47.9)
95.3
(20.3)
9.9
11.4
Tax
33
96
94
104
116
(% of PBT)
18.1
26.6
32.8
33.0
33.0
PAT (reported)
151
263
192
211
235
Extraordinary Items
(3)
95
-
-
-
Less: Minority interest (MI)
0
0
0
0
0
PAT after MI (reported)
151
263
192
210
235
ADJ. PAT
154
169
192
211
235
% chg
(49.0)
9.7
13.9
9.6
11.4
(% of Net Sales)
8.8
9.0
9.1
9.1
9.2
Fully Diluted EPS (`)
111.6
122.4
139.4
152.7
170.2
% chg
(49.0)
9.7
13.9
9.6
11.4
August 16, 2019
4
TTK Prestige |1QFY2020 Result Update
Consolidated Balance Sheet
Y/E March (` cr)
FY2017
FY2018
FY2019
FY2020E
FY2021E
SOURCES OF FUNDS
Equity Share Capital
12
12
12
12
12
Reserves& Surplus
842
1,008
1,155
1,324
1,512
Shareholders Funds
854
1,020
1,166
1,335
1,524
Equity Share Warrants
-
-
-
-
-
Total Loans
113
129
90
90
90
Deferred Tax Liability
-
-
-
-
-
Other liabilties
6.3
5.4
5.4
5.4
5.4
Total Liabilities
973
1,154
1,262
1,431
1,620
APPLICATION OF FUNDS
Gross Block
567
598
612
625
639
Less: Acc. Depreciation
58
108
110
140
170
Net Block
510
490
502
486
469
Capital Work-in-Progress
2
4
21
21
21
Investments
75
167
192
192
192
Current Assets
680
880
986
1,130
1,285
Inventories
380
437
471
537
595
Sundry Debtors
215
258
305
348
406
Cash
65
136
130
130
130
Loans & Advances
20
49
48
69
102
Other Assets
-
-
31
46
51
Current liabilities
281
373
348
488
525
Net Current Assets
400
507
639
643
760
Deferred Tax Asset
(35)
(42)
(44)
(44)
(44)
Total Assets
973
1,154
1,262
1,431
1,620
August 16, 2019
5
TTK Prestige |1QFY2020 Result Update
Cash Flow Statement
Y/E March (` cr)
FY2016
FY2017
FY2018
FY2019
FY2020
Profit before tax
184
359
286
315
351
Depreciation
26
26
26
30
30
Change in Working Capital
(70)
(47)
(110)
(4)
(117)
Interest / Dividend (Net)
(0)
(6)
7
3
(5)
Direct taxes paid
(37)
(93)
(91)
(104)
(116)
Others
(9)
(112)
(24)
2
9
Cash Flow from Operations
94
127
94
241
153
(Inc.)/ Dec. in Fixed Assets
(26)
(12)
(57)
(13)
(13)
(Inc.)/ Dec. in Investments
(142)
9
57
0
0
Cash Flow from Investing
(168)
(3)
(0)
(13)
(13)
Issue of Equity
0
0
0
0
0
Inc./(Dec.) in loans
113
0
(38)
0
0
Dividend Paid (Incl. Tax)
0
0
0
0
0
Interest / Dividend (Net)
(8)
(75)
(5)
(29)
(29)
Cash Flow from Financing
106
(113)
(84)
(70)
(75)
Inc./(Dec.) in Cash
31
11
10
157
64
Opening Cash balances
27
58
69
79
236
Closing Cash balances
58
69
79
236
300
Source: Angel Research, Company
August 16, 2019
6
TTK Prestige |1QFY2020 Result Update
Key Ratios
Y/E March
FY2017
FY2018
FY2019
FY2020
FY2021
Valuation Ratio (x)
P/E (on FDEPS)
52.0
47.4
41.6
38.0
34.1
P/CEPS
45.8
27.9
36.9
33.6
30.4
P/BV
9.5
7.9
6.9
6.1
5.4
Dividend yield (%)
0.5
0.5
0.6
0.6
0.7
EV/Sales
4.6
4.2
3.7
3.4
3.0
EV/EBITDA
37.9
31.6
26.6
24.2
21.9
EV / Total Assets
8.2
6.8
5.8
5.9
5.5
Per Share Data (`)
EPS (Basic)
111.6
122.4
139.4
152.7
170.2
EPS (fully diluted)
111.6
122.4
139.4
152.7
170.2
Cash EPS
127.8
209.5
158.6
174.2
192.2
DPS
27.0
30.0
33.0
36.3
39.9
Book Value
618.6
738.9
845.1
961.5
1,091.8
Dupont Analysis
EBIT margin
10.6
11.9
12.6
12.6
12.7
Tax retention ratio
0.8
0.7
0.7
0.7
0.7
Asset turnover (x)
2.1
2.2
2.3
2.1
2.0
ROIC (Post-tax)
18.3
19.2
19.1
17.7
16.9
Returns (%)
ROCE
19.1
19.3
21.1
20.4
20.1
Angel ROIC (Pre-tax)
22.3
26.2
28.4
26.4
25.2
ROE
18.0
16.6
16.5
15.8
15.4
Turnover ratios (x)
Asset Turnover (Gross Block)
3.1
3.1
3.4
3.7
4.0
Inventory / Sales (days)
79
85
82
85
85
Receivables (days)
45
50
53
55
58
Payables (days)
59
73
60
55
55
Working capital cycle (ex-cash) (days)
66
63
74
85
88
Source: Company, Angel Research
August 16, 2019
7
TTK Prestige |1QFY2020 Result Update
Research Team Tel: 022 - 39357800
DISCLAIMER:
Angel Broking Limited (hereinafter referred to as Angel ) is a registered Member of National Stock Exchange of India Limited, Bombay
Stock Exchange Limited, Metropolitan Stock Exchange Limited, Multi Commodity Exchange of India Ltd and National Commodity &
Derivatives Exchange Ltd It is also registered as a Depository Participant with CDSL and Portfolio Manager and Investment Adviser with
SEBI. It also has registration with AMFI as a Mutual Fund Distributor. Angel Broking Limited is a registered entity with SEBI for Research
Analyst in terms of SEBI (Research Analyst) Regulations, 2014 vide registration number INH000000164. Angel or its associates has not
been debarred/ suspended by SEBI or any other regulatory authority for accessing /dealing in securities Market. Angel or its
associates/analyst has not received any compensation / managed or co-managed public offering of securities of the company covered
by Analyst during the past twelve months.
This document is solely for the personal information of the recipient, and must not be singularly used as the basis of any investment
decision. Nothing in this document should be construed as investment or financial advice. Each recipient of this document should make
such investigations as they deem necessary to arrive at an independent evaluation of an investment in the securities of the companies
referred to in this document (including the merits and risks involved), and should consult their own advisors to determine the merits and
risks of such an investment.
Reports based on technical and derivative analysis center on studying charts of a stock's price movement, outstanding positions and
trading volume, as opposed to focusing on a company's fundamentals and, as such, may not match with a report on a company's
fundamentals. Investors are advised to refer the Fundamental and Technical Research Reports available on our website to evaluate the
contrary view, if any
The information in this document has been printed on the basis of publicly available information, internal data and other reliable
sources believed to be true, but we do not represent that it is accurate or complete and it should not be relied on as such, as this
document is for general guidance only. Angel Broking Limited or any of its affiliates/ group companies shall not be in any way
responsible for any loss or damage that may arise to any person from any inadvertent error in the information contained in this report.
Angel Broking Limited has not independently verified all the information contained within this document. Accordingly, we cannot testify,
nor make any representation or warranty, express or implied, to the accuracy, contents or data contained within this document. While
Angel Broking Limited endeavors to update on a reasonable basis the information discussed in this material, there may be regulatory,
compliance, or other reasons that prevent us from doing so.
This document is being supplied to you solely for your information, and its contents, information or data may not be reproduced,
redistributed or passed on, directly or indirectly.
Neither Angel Broking Limited, nor its directors, employees or affiliates shall be liable for any loss or damage that may arise from or in
connection with the use of this information.
Disclosure of Interest Statement
TTK Prestige
1. Financial interest of research analyst or Angel or his Associate or his relative
No
2. Ownership of 1% or more of the stock by research analyst or Angel or associates or
No
relatives
3. Served as an officer, director or employee of the company covered under Research
No
4. Broking relationship with company covered under Research
No
Ratings (Based on Expected Returns:
Buy (> 15%)
Accumulate (5% to 15%)
Neutral (-5 to 5%)
over 12 months investment period)
Reduce (-5% to -15%)
Sell (< -15%)
August 16, 2019
8